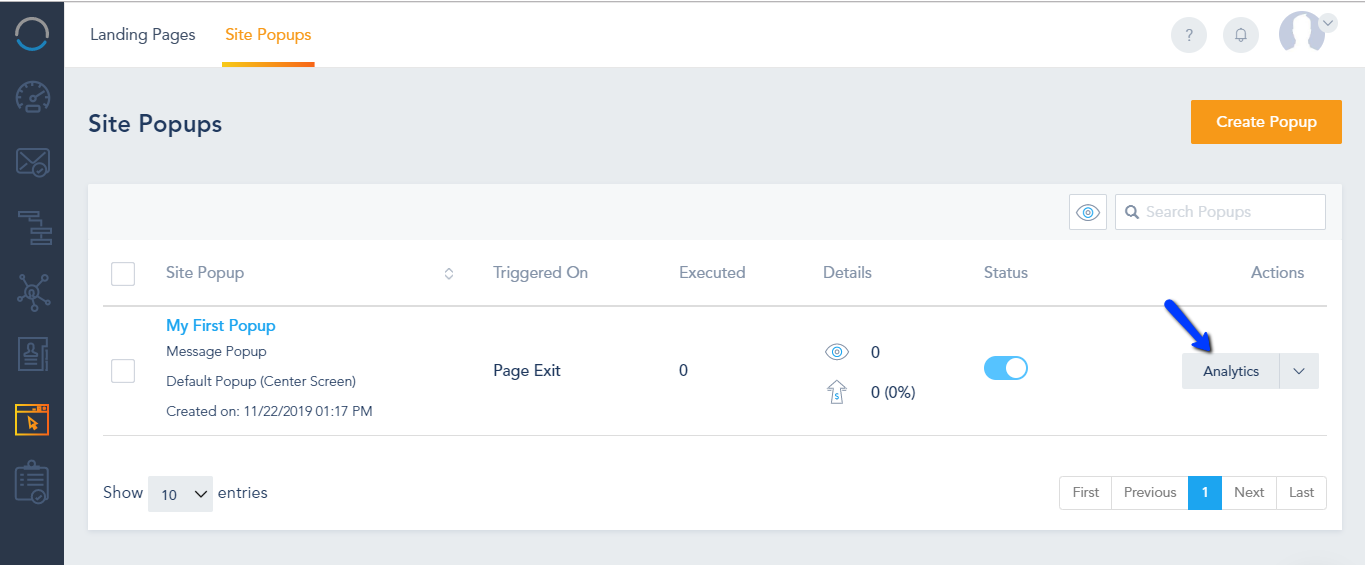
To access the Site Popups Analytics, click on Analytics.
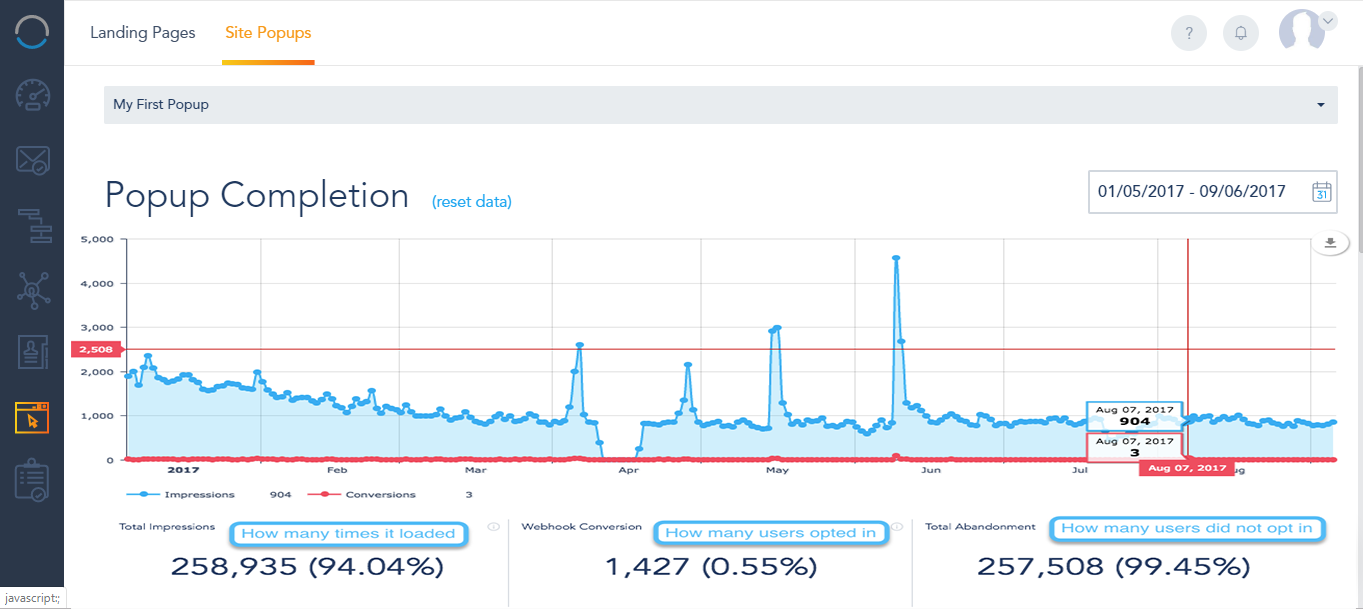
Inside the analytics section, you can see a data chart on how many times the Webhook executed, along with the conversion and abandonment rate. The date range is 30 days by default and can change to your desired time period.
Below the chart, you get a breakdown of the traffic that triggered this Site Popup by Visitors Type, Cookied Contacts vs Anonymous Visitors, along with the rate for each.
The referral pie chart breaks it down by General referral sources, Paid referrals and Social referrals.
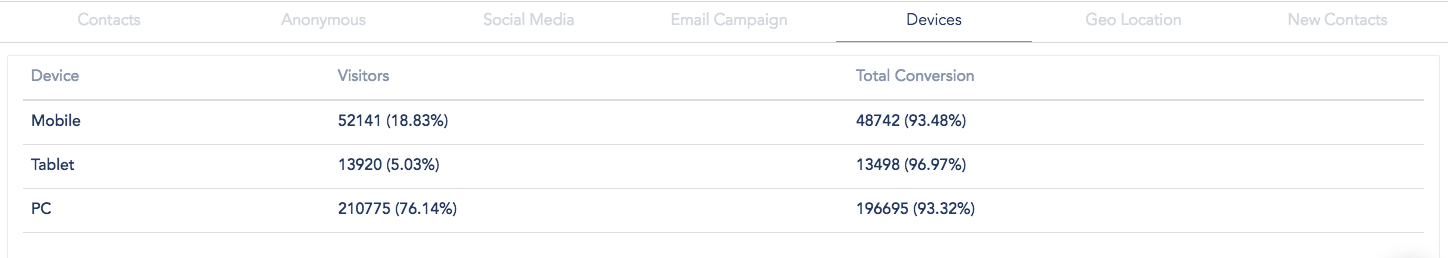
Further down, you can switch between the different tabs to view the contacts who viewed the Site Popup, the IP address of the Anonymous Visitors, the Social Media events that triggered the Site Popup (you must be using the Social Media tools on your account), as well as the Geo Location and Devices breakdown. The New Contacts filter displays information about the contacts that filled out the form and completed the conversion.