To access the analytics on your goals:
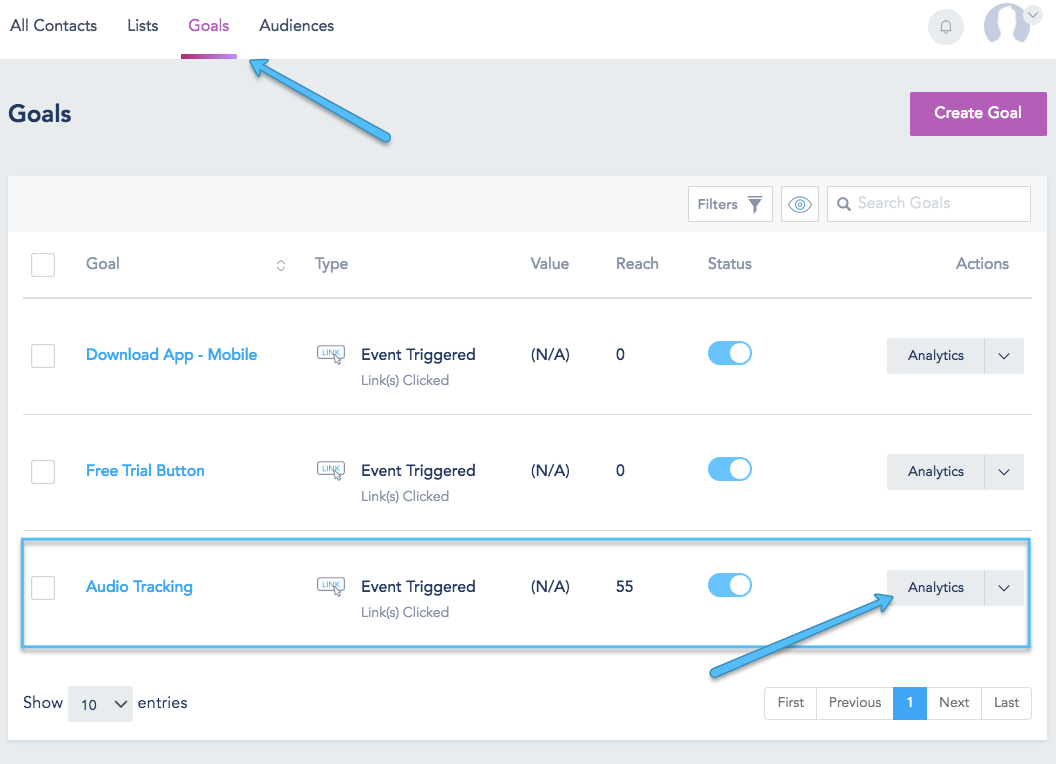
- Click on Contacts > Goals from the top bar when in Contacts option.
- The page will display a table summary of your goals type and performance summary. Find your desired goal and click on the Analytics option next to that goals.
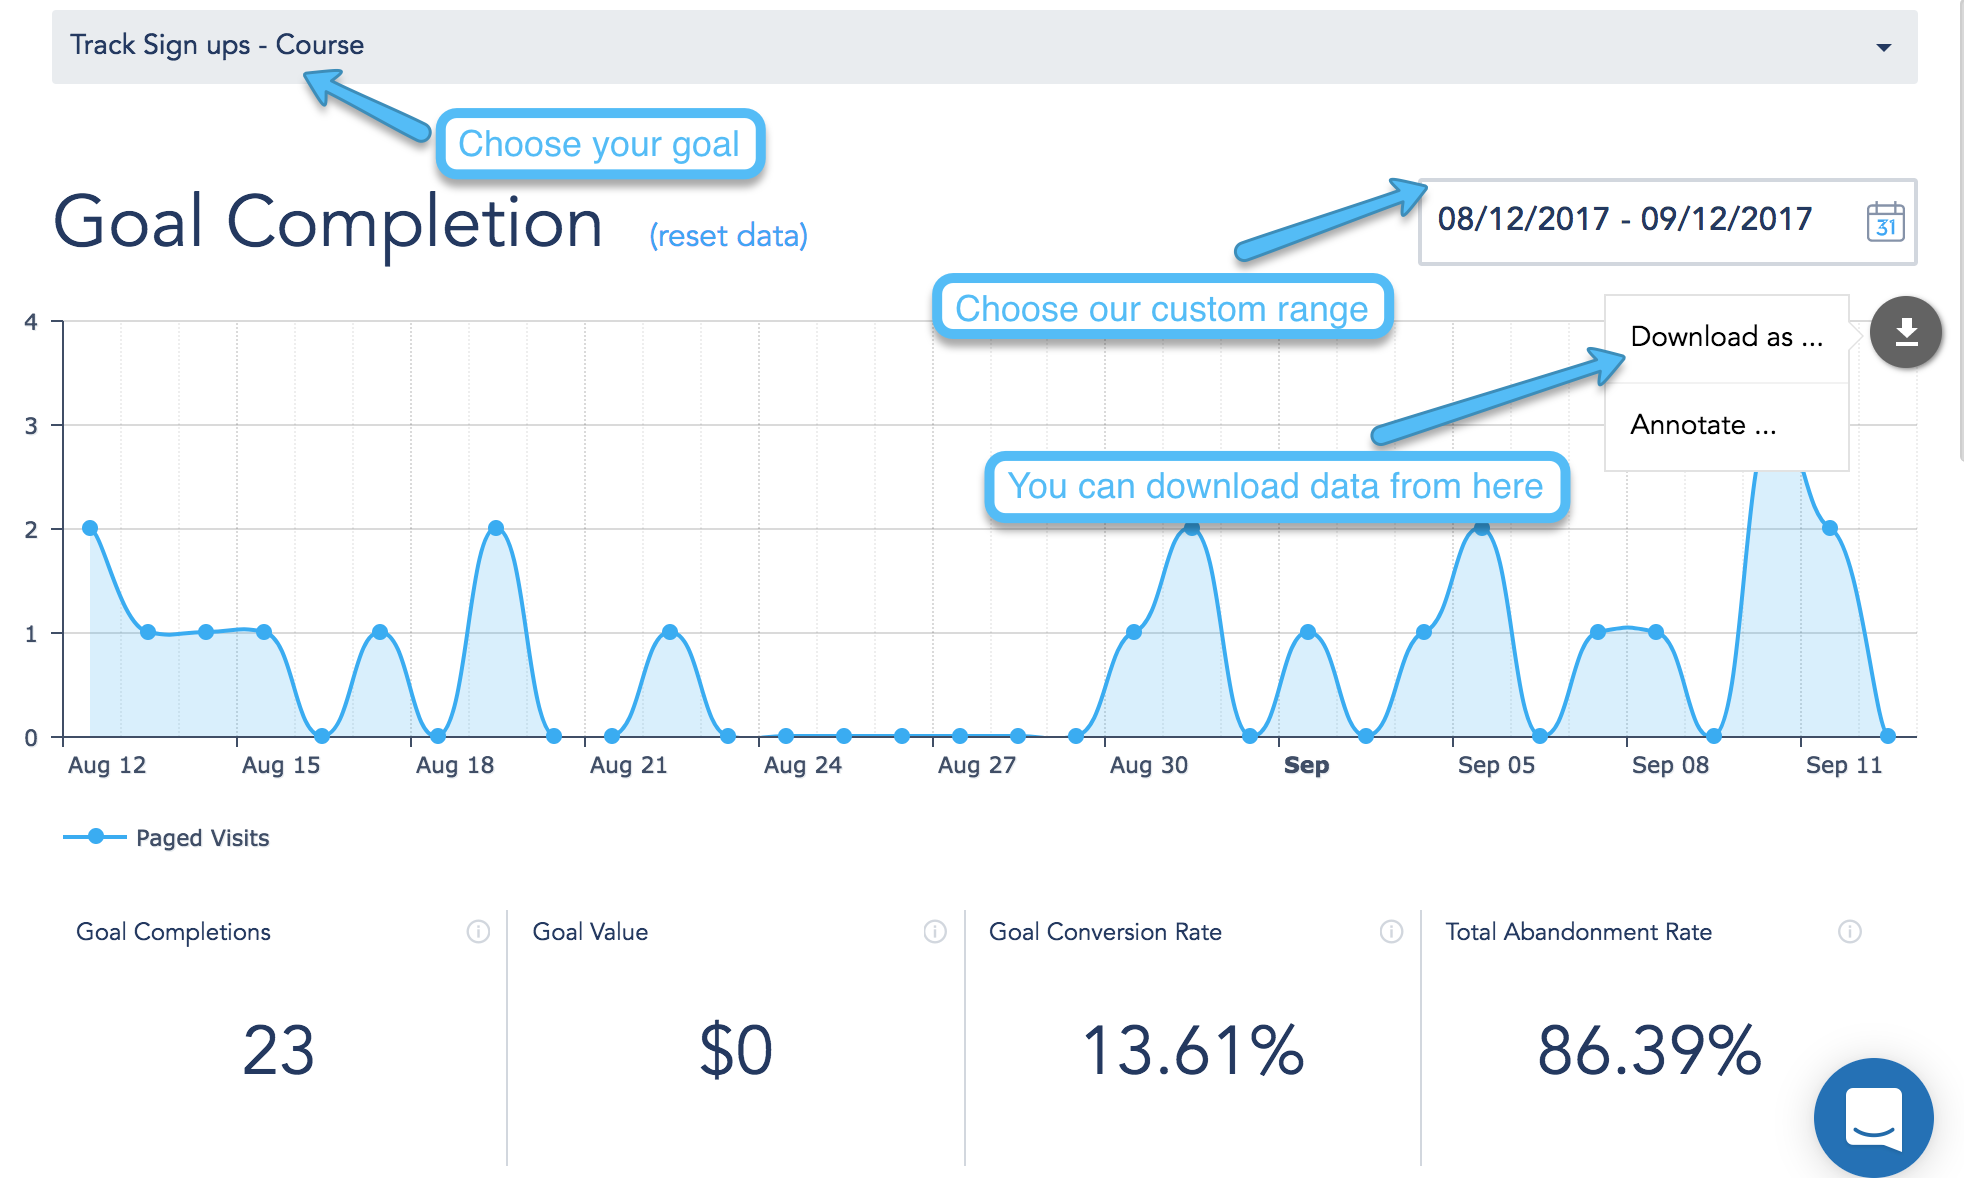
- The top preview of the report include a drop down to easily switch between goals and a line-chart of the daily conversion of that goal. You can change the default time period of that report by clicking on the date-picker.
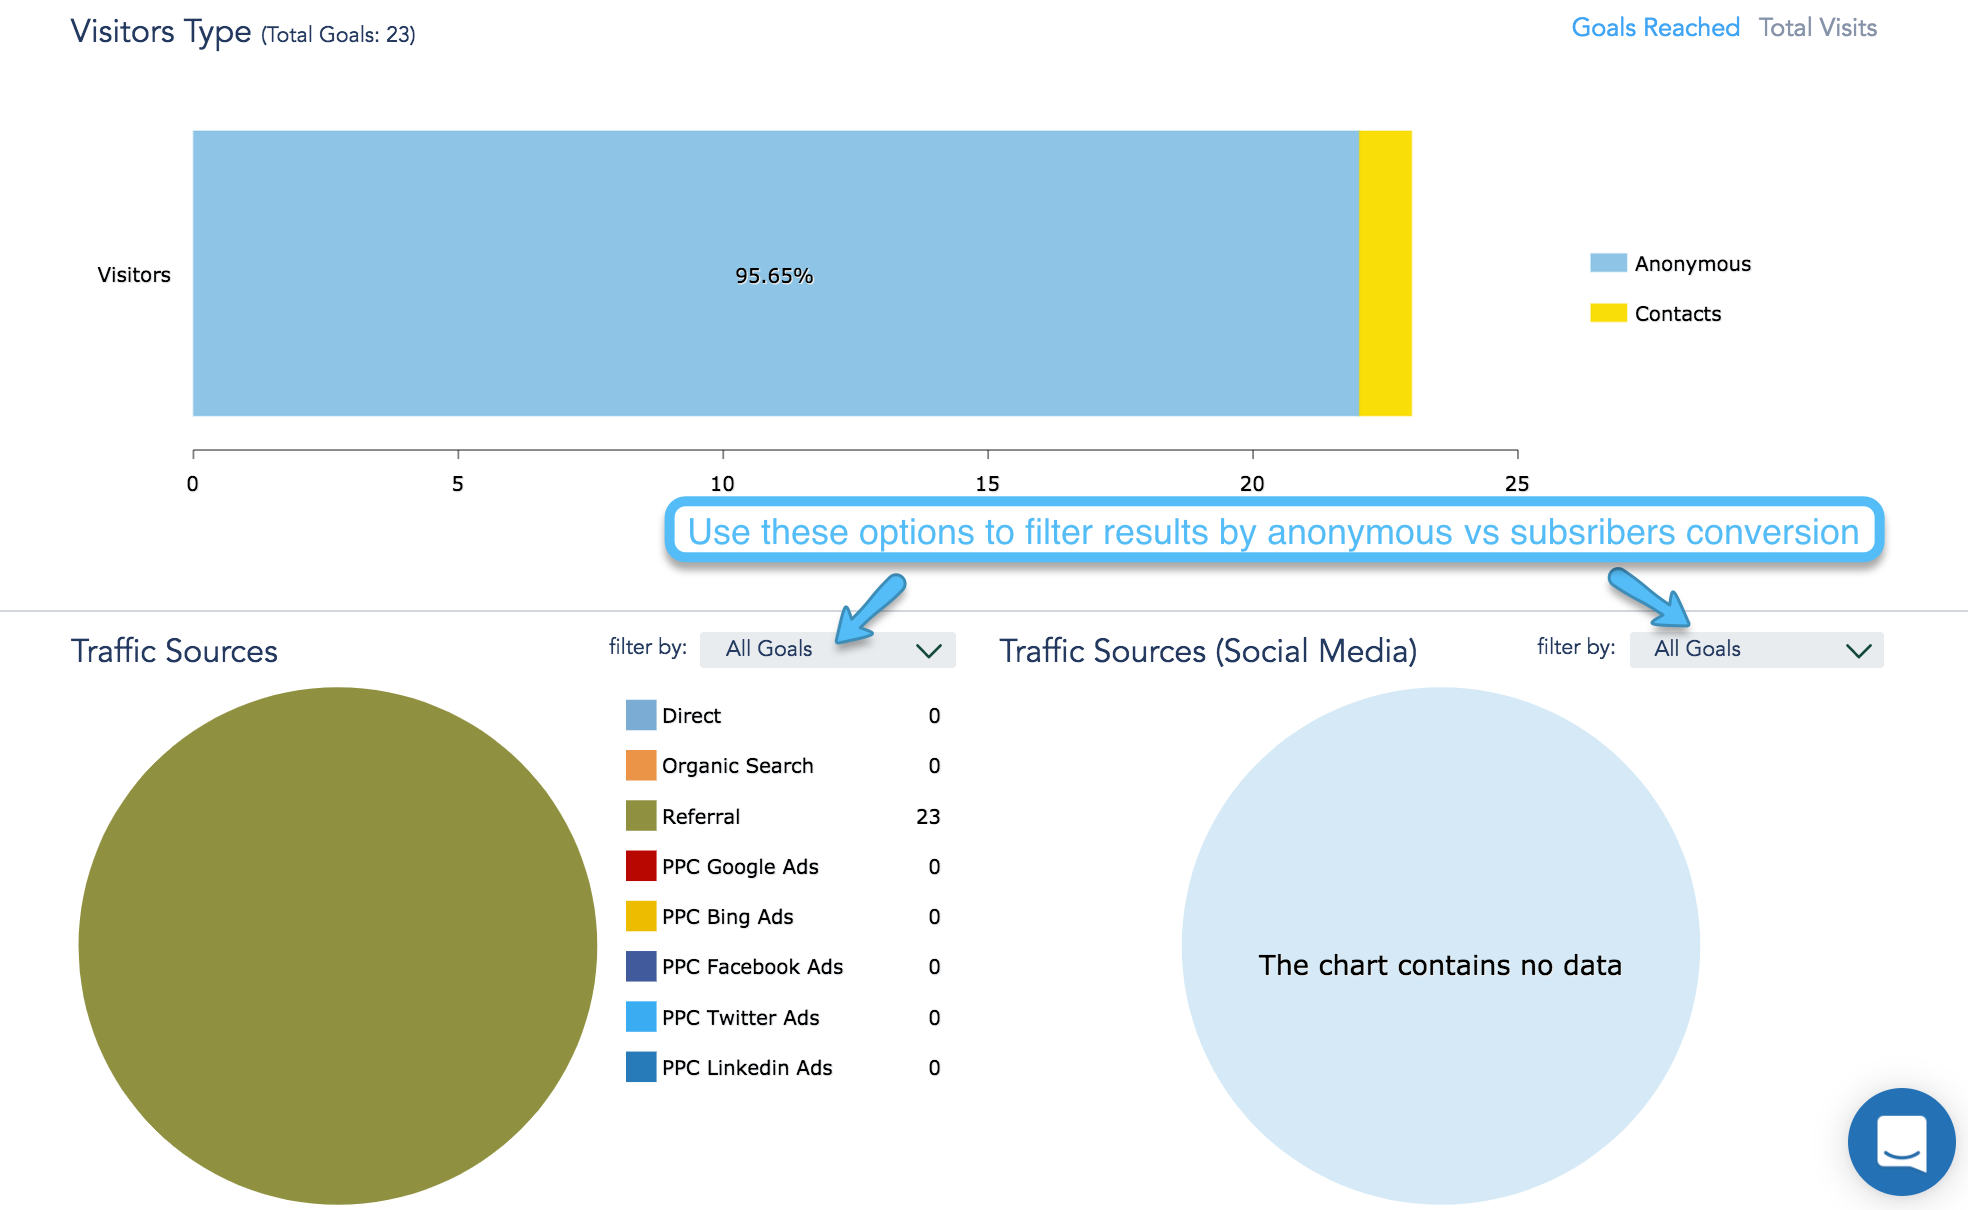
- The bar chart displays the percentages for the types of users who reached that goal. It is broken down by Anonymous (random visitors without contact information) and Contacts (Active contacts that are cookied and can be found under your Contacts lists).
- Traffic Sources displays 2 pie charts broken down by the original source of users who reached the goal, whereas the left panel represents Direct, Organic, Referral and PPC sources and the right pie chart represents all conversions that came from Social Media.
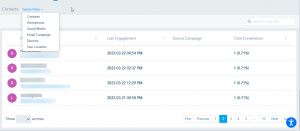
- The table below gives you a detailed breakdown of who are the Contacts that reached your goal, the Anonymous IP’s and their full profile, which social media events and email campaigns triggered this goal, the demographics of the users as well as conversion by device type.